Rendering a 3D shape with Python
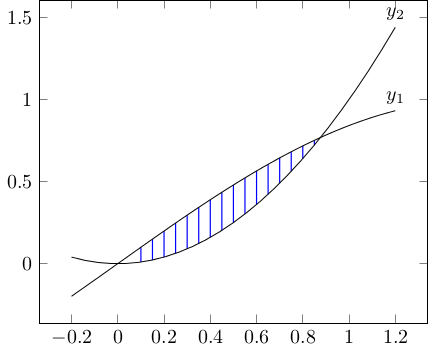
A friend wanted to 3D-print a shape to demonstrate using calculus to find the volume of solids of known cross-section. The shape he wanted was a graph of $sin(x)$ vs $x^2$, where each vertical slice of the intersection was a square. Here's the graph, with $y_1 = sin(x)$ and $y_2 = x^2$. The blue lines show the edge of each square. He couldn't figure out how to do this in a CAD program (I'm not even sure if it's possible), so he asked me if I could write some code to render it.
Multinomial Probability Mass Function in TI-BASIC
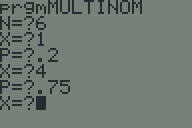
Another TI-BASIC challenge proposed to me by the same person who asked me last time was to calculate the probability mass function of a multinomial distribution. The formula is:
Calculating the mode of a list in TI-BASIC
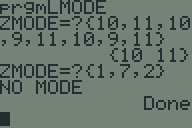
Recently, someone challenged me to write a program to find the mode (or modes) of a list in TI-BASIC. I picked up my TI-83+ and whipped this program up in about half an hour. Somebody else asked me for a copy, so I figured I'd post it on my website.